Visual calculations in Power BI : A new approach for more agile analyses
With the arrival of Visual Calculations, Power BI further enriches its range of analysis tools. This feature allows you to create calculations directly in a visual, without weighing down the model or multiplying measurements. A more agile approach, designed to speed up ad hoc analyses and simplify conditional formatting, while offering users greater flexibility.
- What are Visual Calculations?
A Visual Calculation is a DAX expression defined and executed directly in a visual. Unlike measures or calculated columns, it is not stored in the data model, but is specific to the visual in which it is created. This allows calculations specific to a visual to be performed without weighing down the overall model.
In addition, the latest updates now allow these visual calculations to be used directly as input for conditional formatting. This makes it much easier to create color codes/legends tailored to a particular visual.
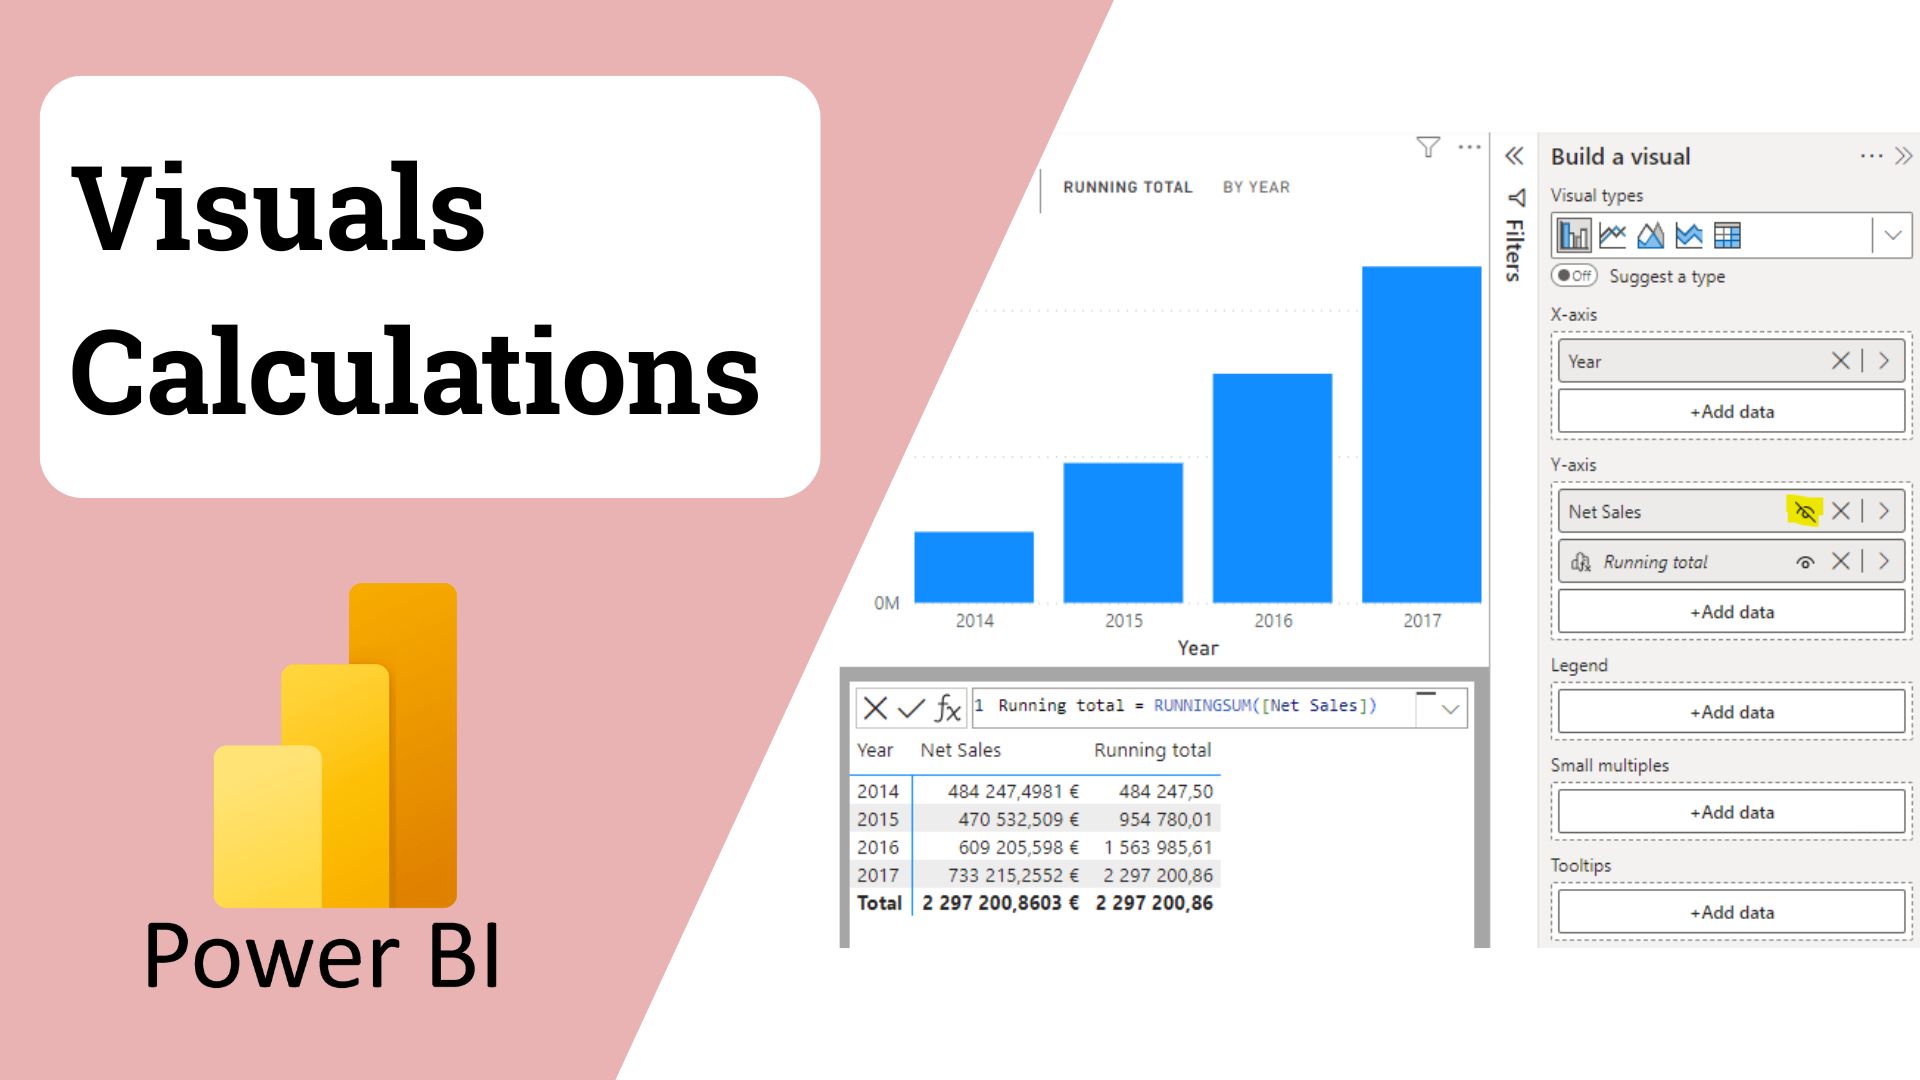
For example, to calculate a cumulative sales total in a table (based on date, for example), simply add a Visual Calculation with the formula:
Sales total = RUNNINGSUM(Sales amount)
This calculation applies only to the relevant visual and does not require creating an additional measure or column in the model.
- Advantages of Visual Calculations
Simplicity : Visual Calculations allow you to quickly create calculations specific to a visual without modifying the data model.
Flexibility : They are ideal for ad hoc analyses or quick tests, without impacting the overall model.
Performance : By operating on aggregated data at the visual level, they can offer better performance than complex measurements.
- Limitations to consider
Re-use : Visual Calculations cannot be reused in other visuals or reports.
Limited features : They cannot be used in slicers, filters, or to establish relationships between tables.
Exportation : The results of Visual Calculations are not included when exporting the underlying data.
Limited DAX functions : Certain DAX functions, particularly those related to table relationships, are not available in Visual Calculations.
- Use Cases
Calculation of profit margin
Margin = Sales amount – Total cost
Displays the margin for each line of the visual without adding a column to the template.
Total percentage
% of Grand Total = DIVIDE(sales amount,COLLAPSEALl(sales amount))
Displays each element’s contribution to the overall total directly in the visual.
- Conclusion
Visual Calculations enrich the arsenal of analysis tools in Power BI by offering a quick and flexible method for performing calculations specific to visuals. They are particularly useful for one-off analyses or prototypes, while maintaining a clean data model. However, for calculations that are reusable or require deeper integration into the model, measures and calculated columns remain indispensable.
To learn more about Visual Calculations, check this documentation.
We encourage you to test this new tool in Power BI even if the use is not applicable to every situation. This could save you time.
At Myrmidons, many of our consultant use Power BI as the main reporting tool in their missions with our partners. This technology has become the go to when speaking of reporting. By mastering advanced features such as visual calculations, we help organizations leverage Power BI to create clearer, more actionable dashboards. As companies increasingly rely on data-driven decision-making, adopting these capabilities is essential to transform raw data into real business value.